GUI
Simple functionality of scqubits (concerned with individual qubits as opposed to coupled systems) can be accessed through a graphical user interface. Firing up this GUI from a jupyter notebook starts with importing the scqubits library
[1]:
import scqubits as scq
To display the interface, simply run the following:
[ ]:
scq.GUI()
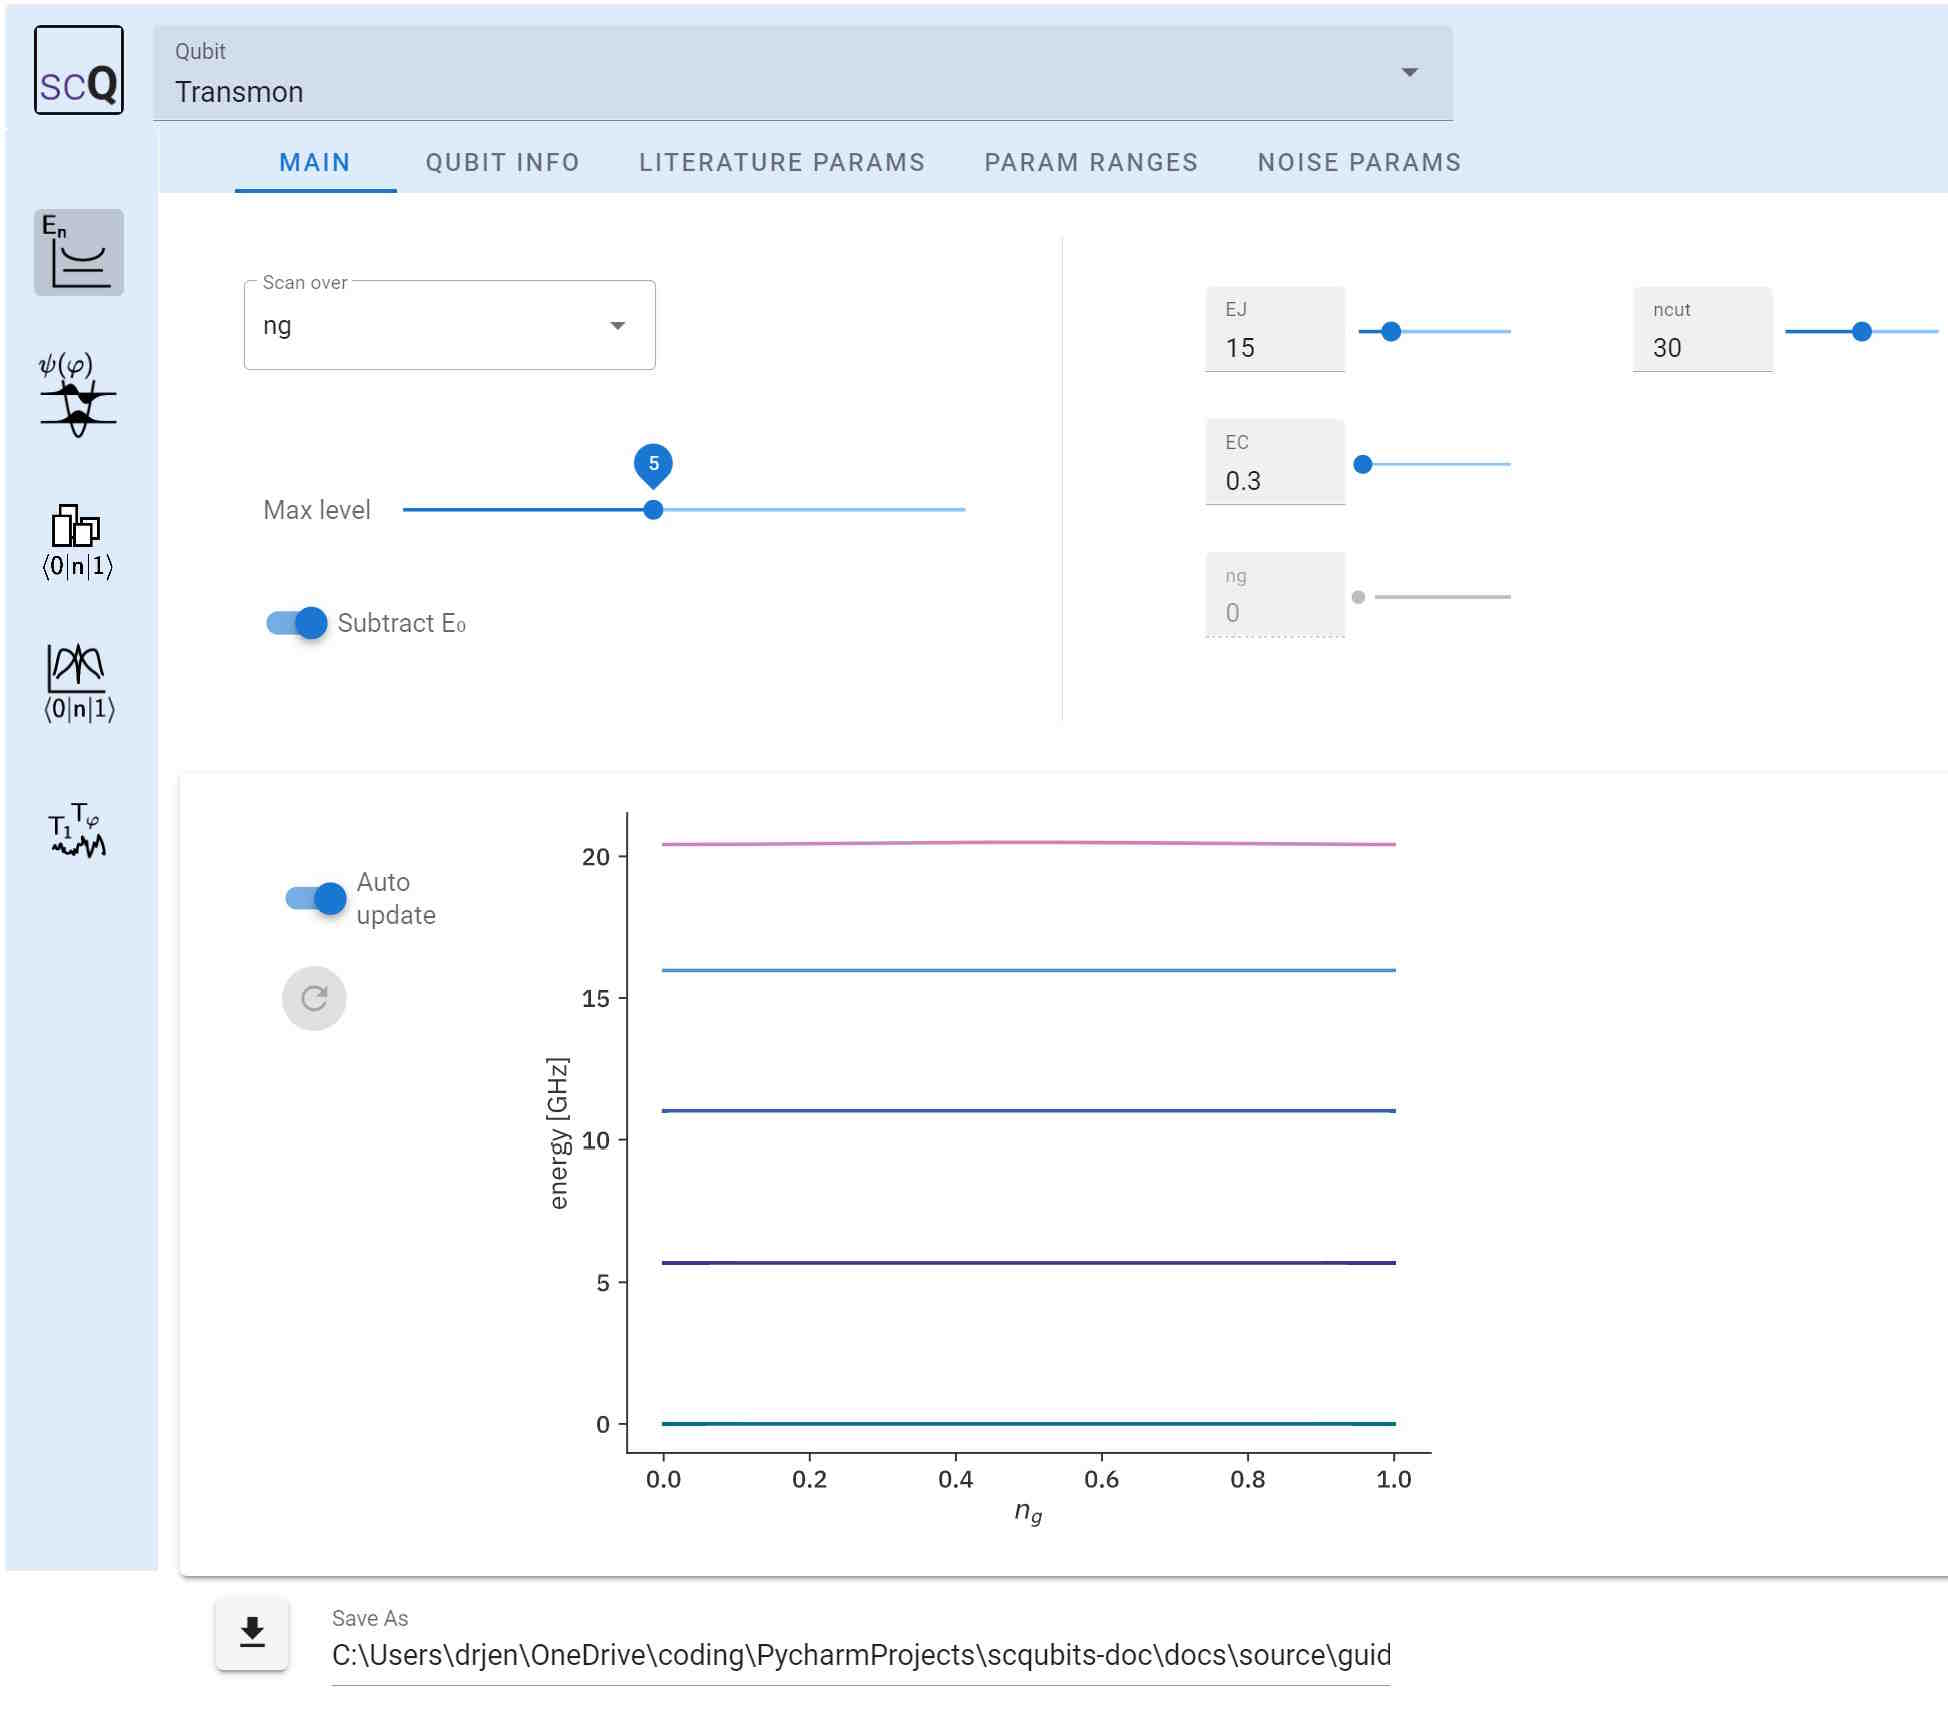
A reference to the Figure and Axes of the latest plot generated by the gui above is stored in a variable GUI.fig_ax, which can be easily accessed for further customization. For example:
[3]:
fig, ax = scq.GUI.fig_ax
ax.set_xlabel(r"charge offset $n_g$")
fig
[3]:

[ ]: